
What is your encounter rejection rate costing you?
Every rejected 837 comes back to your team for manual repair — roughly $35 of labor each, forever, unless the root cause is fixed upstream. At 120,000 records a month and a 7.5% rejection rate, that is a $3.8 million line item hiding inside your administrative ratio — before penalties, and before the state starts asking about the trend.
How do payers reduce encounter rejection rates?
Payers reduce encounter rejection rates by encoding the state's companion guide as executable validations that run before a file is submitted, classifying historical rejections into a root-cause taxonomy, correcting the upstream mappings that generate them, and monitoring the rate weekly — rather than repairing rejected records downstream by hand.
The receiving system validates every record against hundreds of rules. Whatever fails comes back as manual work. Running the same rules yourself, before the file leaves the building, converts a permanent labor line into a one-time engineering fix.
Rejection rework is the most expensive kind of routine
Rework consumes an administrative budget that the Medical Loss Ratio rule already caps at roughly 15% of premium. Worse, chronic rejection rates attract state attention — and for Medicaid managed care plans, the contract itself is the thing at risk.
The pattern nobody defends but everyone runs: staff repairing the same class of record month after month, while the mapping that generates the failure stays untouched. Fixing the source once removes the labor permanently.
Your rejection arithmetic
Move the sliders to your own numbers. The output is the version of this problem your finance team will recognize — annual rework spend, and what returns at a sustained sub-3% rate.
Your submission profile
Defaults reflect the industry rework benchmark of about $35 per record and a chronic rejection profile. The target line uses under 3% — the rate Artha sustains at state and APCD scale for its Blues-plan anchor client.
The case you take to your CFO
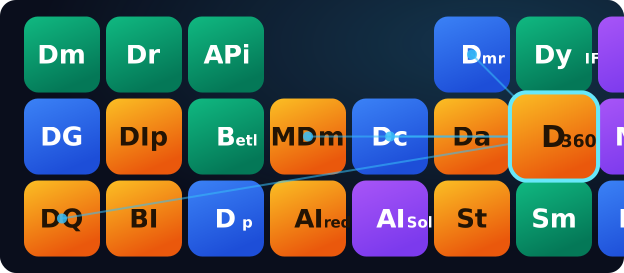
The submission symptoms that point at root causes
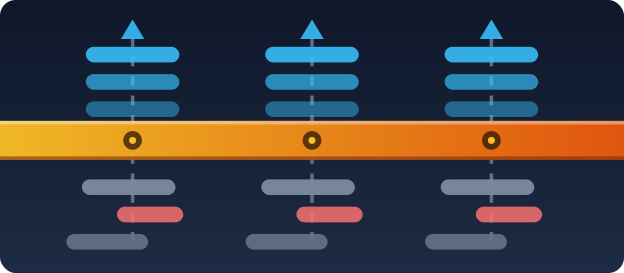
What a pre-submission firewall looks like
-
1
Generate 837 encounters from paid claims, on the cadence each program requires
-
2
Enrich provider and member identifiers per the receiving agency's rules
-
3
Run companion-guide validations pre-submission, across the SNIP tiers the agency applies
-
4
Submit — with the failures already removed rather than discovered downstream
-
5
Parse the responses and auto-classify every rejection by root cause
-
6
Fix upstream, not just the record, and monitor the rate weekly so regressions surface fast
Your actual rejection history, profiled into a root-cause taxonomy with the upstream fixes attached — the version your CFO signs off on. Outcome-based pricing anchors here.
What good looks like — and where it's already running
Results from Artha's anchor engagement at one of the largest Blue Cross Blue Shield plans. Presented as capability proof from a single client — not industry averages.
Encounter data quality, answered
An X12 837 file reporting every service delivered to members, submitted to state Medicaid agencies, CMS, or a state all-payer claims database. The receiving system validates each record against hundreds of rules and rejects those that fail, returning them for correction and resubmission.
A state or agency's local rulebook layered on top of the national X12 standard. It specifies which fields are required, which code combinations are valid, and how identifiers must be populated. Companion guides change, and drift between the guide and a plan's mapping is a leading cause of rejections.
Chronic rates above 5% are common and expensive. A sustained rate below 3% is achievable with pre-submission validation — that is the level Artha holds at APCD scale for its anchor client, preventing roughly 8,000 rejections a month.
A tiered framework (levels 1 through 7) describing how deeply an X12 file is checked — from basic syntax and structure through implementation-guide conformance to trading-partner-specific and payer-specific business rules. Running the deeper tiers before submission is what catches failures early.
Roughly $35 in fully loaded labor for each record a staff member must research, correct, and resubmit. At 120,000 records a month and a 7.5% rejection rate, that is about $3.8 million a year in rework — before any state penalties.
Root causes. Rejections are classified into a taxonomy — bad member match, missing provider identifier, invalid code combination, date logic — and the upstream mapping is corrected so the same failure stops recurring. Repairing records downstream forever is the anti-pattern.
Stop paying for the same rejection twice
A 30-day audit tells you exactly which upstream fixes remove the most rework.